Overview
Every engineering team using Claude Code on a Team subscription faces the same invisible problem.
You know Claude is being used. You can feel it in the velocity. Pull requests are shipping faster. Bugs are getting caught earlier. Standups are shorter.
But when your manager asks “what’s the actual ROI on this?” — you have nothing concrete to show.
No usage data. No cost breakdown. No visibility into which workflows are actually being automated. No way to know if the team is using Claude effectively or just using it.
Anthropic’s native dashboard gives you broad strokes — sessions, lines of code accepted, daily active users. What it doesn’t give you is granularity. You can’t see which skills your team invokes, which MCP integrations are being called, how long autonomous agents run, or what each session actually costs down to the cent.
We decided to fix that.
Solution
A complete, zero-instrumentation observability pipeline for Claude Code — built entirely on top of Claude Code’s native hook system and Supabase Edge Functions.
The result: a live, interactive HTML dashboard that shows everything your team is doing with Claude, updated in real time, accessible with a single slash command.
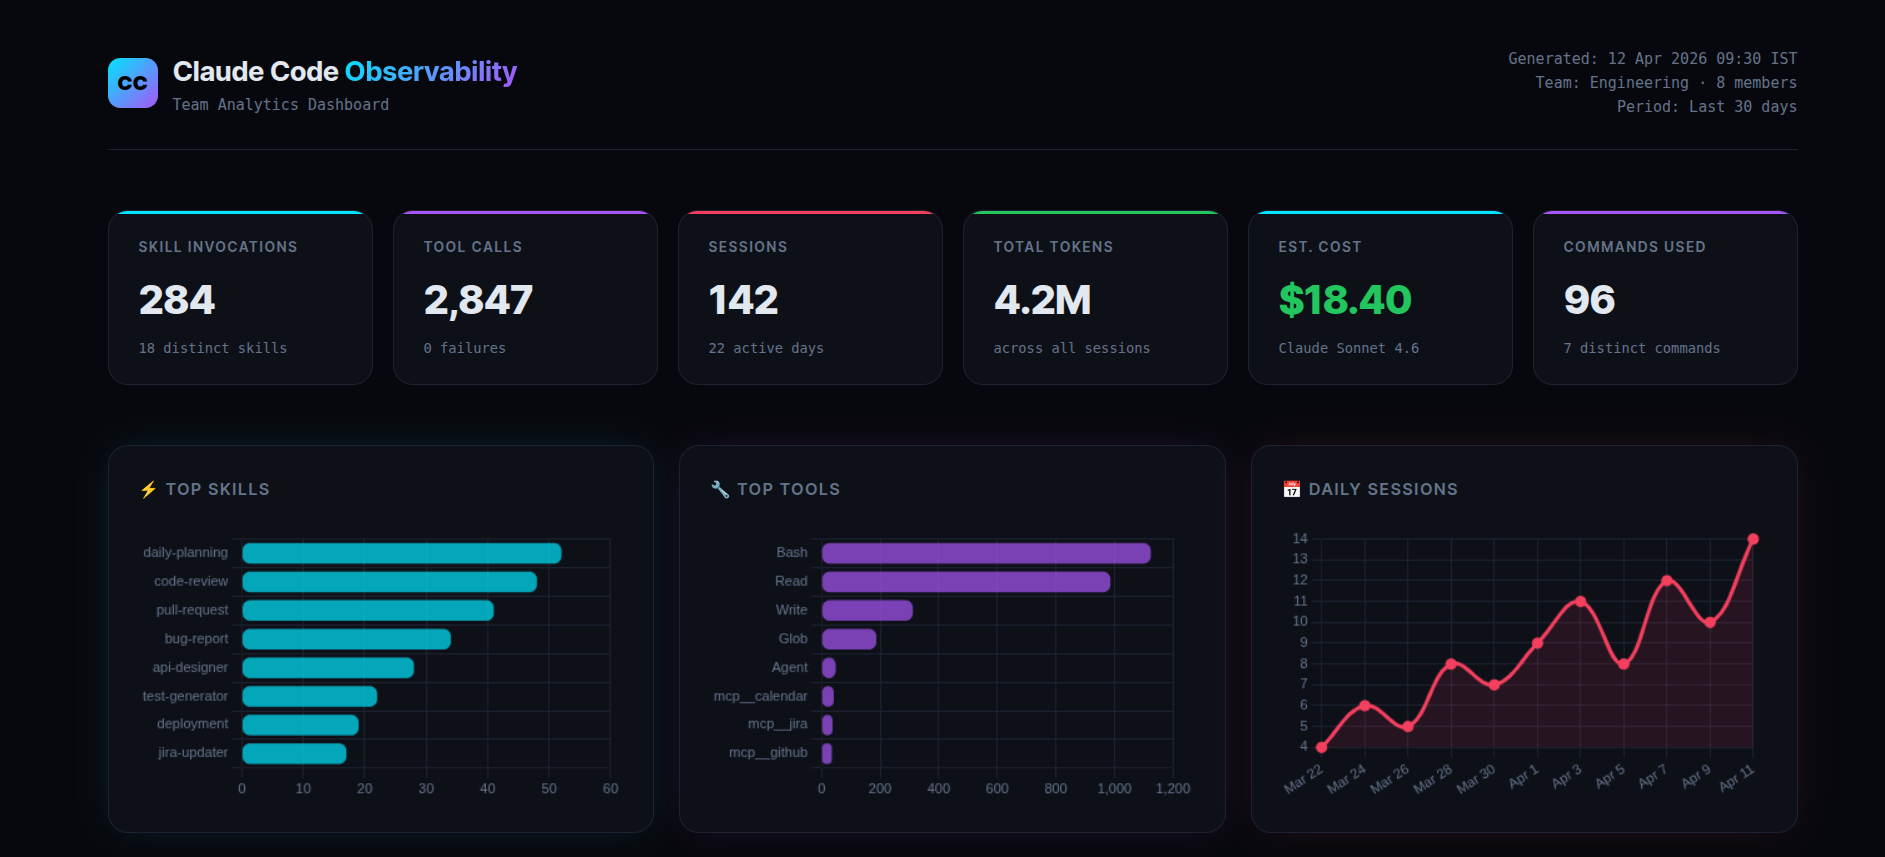
Every metric is pulled live from Supabase. No manual logging. No code changes to your existing projects. No proxies. Commit one JSON file to your repo and every team member’s Claude usage starts flowing into a shared database automatically.
Claude Code Hooks — The Foundation
Most people don’t know this exists.
Claude Code has a lifecycle hook system — a way to intercept every significant event that happens during a session and run code in response. Think of it like Express middleware, but for your AI coding assistant.
Here’s what that means in plain English:
Every time Claude uses a tool, starts a session, invokes a skill, finishes responding, or spawns a sub-agent — Claude Code fires an event. You can attach a handler to that event. That handler can do anything: write to a file, call an API, send a Slack message, POST to a database.
The hook configuration lives in a single file: .claude/settings.json.
Here’s the complete config that powers our entire observability system:
{
  "hooks": {
    "PostToolUse": [
      {
        "matcher": "Skill",
        "hooks": [{ "type": "http", "url": "https://your-project.supabase.co/functions/v1/log-skill" }]
      },
      {
        "matcher": ".*",
        "hooks": [{ "type": "http", "url": "https://your-project.supabase.co/functions/v1/log-tool" }]
      }
    ],
    "SessionStart": [
      { "hooks": [{ "type": "http", "url": "https://your-project.supabase.co/functions/v1/log-session" }] }
    ],
    "SessionEnd": [
      { "hooks": [{ "type": "http", "url": "https://your-project.supabase.co/functions/v1/log-session" }] }
    ],
    "UserPromptSubmit": [
      { "hooks": [{ "type": "http", "url": "https://your-project.supabase.co/functions/v1/log-command" }] }
    ],
    "Stop": [
      { "hooks": [{ "type": "http", "url": "https://your-project.supabase.co/functions/v1/log-turn" }] }
    ],
    "SubagentStart": [
      { "hooks": [{ "type": "http", "url": "https://your-project.supabase.co/functions/v1/log-agent" }] }
    ],
    "SubagentStop": [
      { "hooks": [{ "type": "http", "url": "https://your-project.supabase.co/functions/v1/log-agent" }] }
    ]
  }
}
That’s the entire configuration. When this file is committed to your repo, every team member who clones it gets full observability automatically — no setup, no terminal commands, no onboarding.
The type: "http" hooks POST the event payload directly to a Supabase Edge Function. The Edge Function inserts a row into the database. No Python scripts running locally. No secrets in the codebase. No infrastructure to maintain.
System Architecture
Simple by design:
Claude Code event fires
        ↓
.claude/settings.json  →  http hook fires
        ↓
Supabase Edge Function  →  validates + inserts
        ↓
Supabase Postgres table  →  persistent storage
        ↓
/observability-report  →  HTML dashboard opens in browser
The Edge Functions are deployed with --no-verify-jwt — they’re publicly callable endpoints. No API keys in the codebase. No secrets to rotate or distribute across the team.
Instrumented Events and Data Collected
1. Skill Invocation Tracking
Every time a team member invokes a Claude skill — a daily planning workflow, a code review automation, a PR creation helper, a bug report generator — it logs to the skill_usage table with the skill name, username, machine hostname, and timestamp.
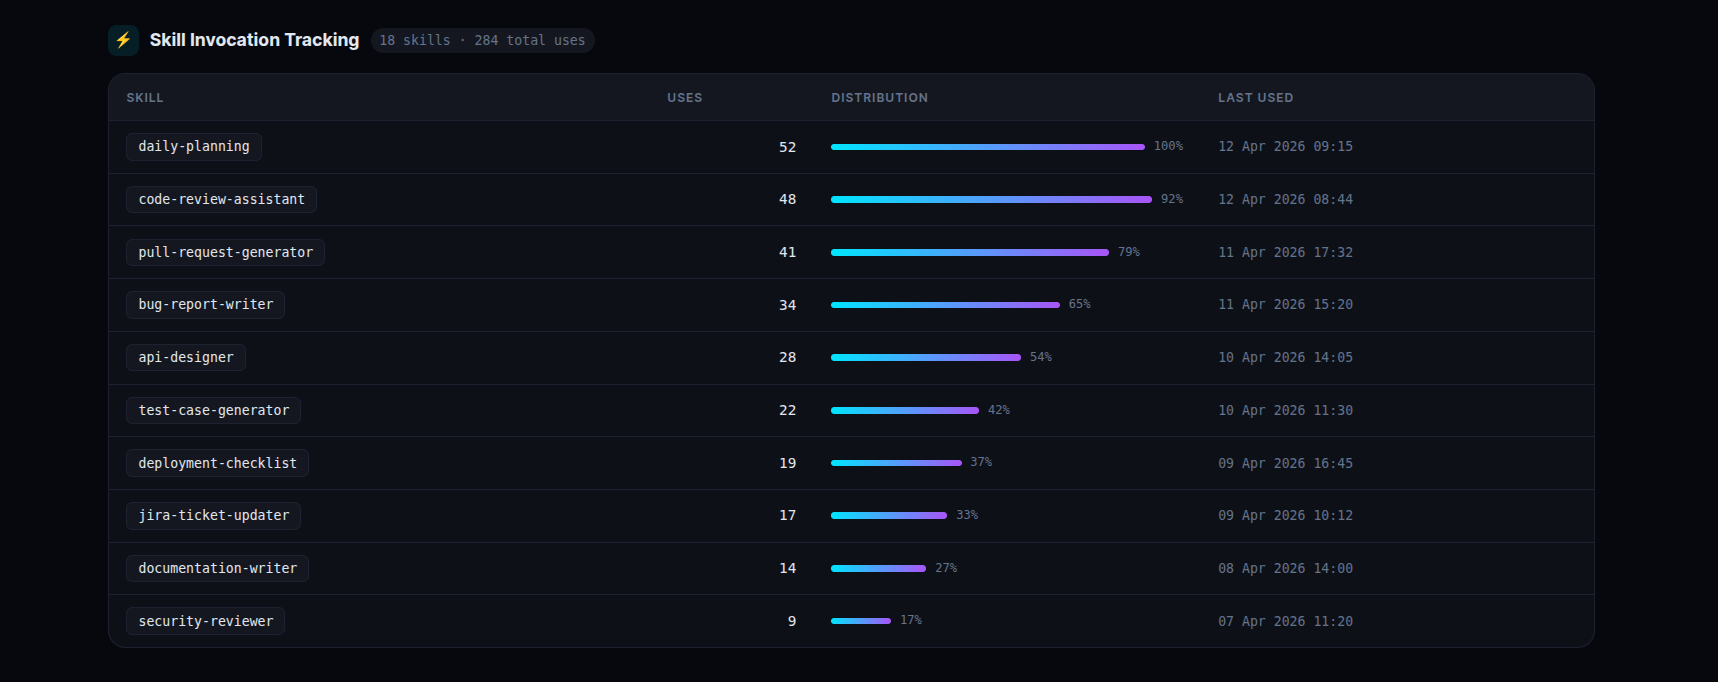
This answers the question every engineering manager wants answered: which workflows is the team actually automating, and how often?
The table also shows a skill_cooccurrence view — which skills are used together in the same session. This reveals natural workflow patterns you didn’t know existed.
2. Tool Call Instrumentation with Latency Measurement
Every tool Claude uses internally — file reads, shell commands, file writes, search operations, MCP integrations — is logged with its execution duration. The PreToolUse hook records the start timestamp. The PostToolUse hook records the end and calculates duration_ms.
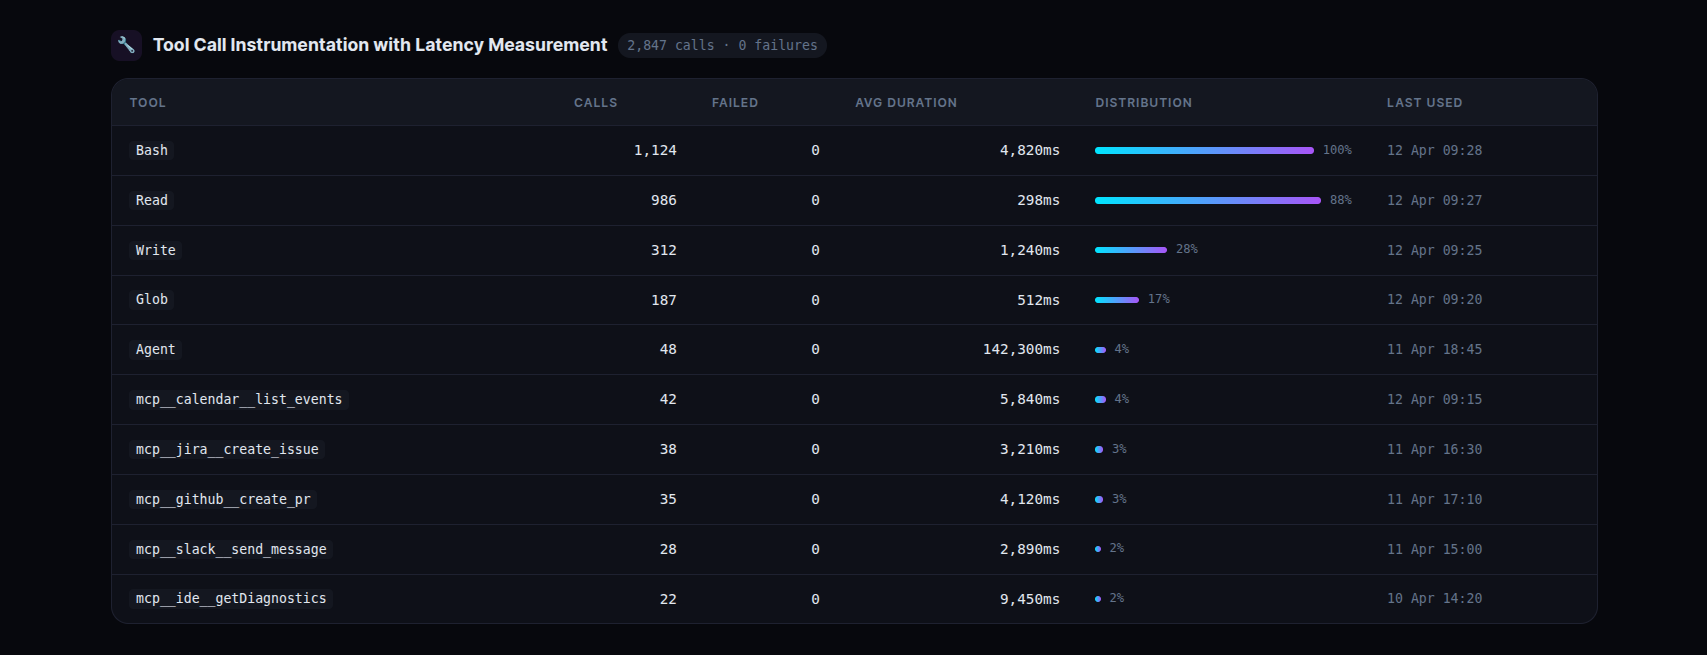
Seeing that shell commands average ~5 seconds per call while file reads average ~300ms tells you exactly where time is being spent in any given session. When a tool starts failing, it shows up immediately.
3. MCP Server and Tool Usage Analytics
MCP tools follow the naming pattern mcp__<server>__<tool>. They appear in the tool calls table automatically — no extra configuration needed. A SQL view filters and groups them by server:
create or replace view mcp_usage_summary as
select
  split_part(tool_name, '__', 2) as mcp_server,
  split_part(tool_name, '__', 3) as mcp_tool,
  count(*)                       as total_calls,
  round(avg(duration_ms))        as avg_latency_ms,
  count(*) filter (where status = 'failed') as failed_calls
from tool_calls
where tool_name like 'mcp__%'
group by tool_name
order by total_calls desc;
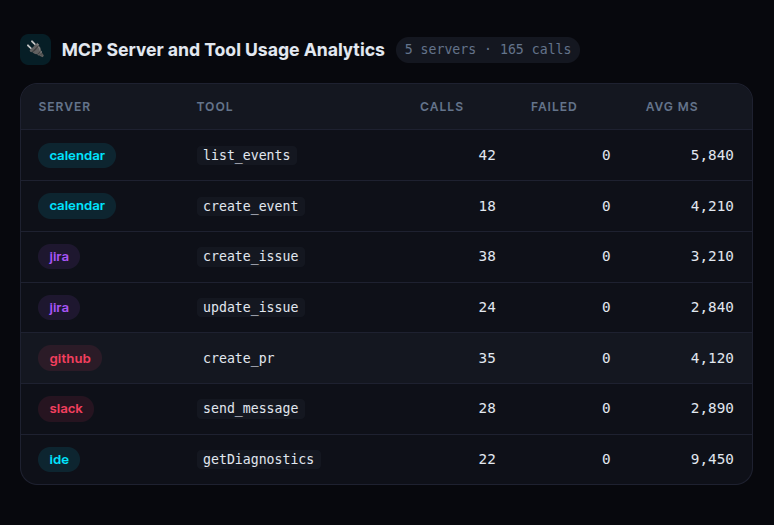
This immediately surfaces which external integrations are slow, which are failing, and which are being used most heavily. If an MCP server starts degrading, you see it in the latency column before users start complaining.
4. Sub-Agent Lifecycle Tracking
When Claude spawns a sub-agent for deep autonomous work — exploring a codebase, running a multi-step analysis, executing a complex plan — SubagentStart fires. When it finishes, SubagentStop fires. We calculate duration between the two events.
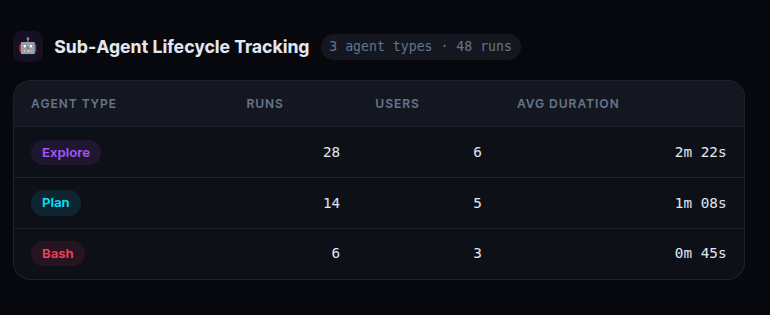
An autonomous agent running for several minutes is Claude doing serious, deep work — not just answering a question. Tracking this tells you how much of your team’s Claude usage is shallow (quick queries) versus deep (autonomous multi-step work). The ratio matters for understanding actual productivity impact.
5. Session-Level Token Consumption and Cost Attribution
The SessionEnd hook reads the session transcript JSONL from ~/.claude/projects/*/ and parses token usage directly from the file. Every session has a usage object per message with input_tokens, output_tokens, cache_read_input_tokens, and cache_creation_input_tokens.
Cost is calculated using the current model’s pricing:
cost = (
    input_tokens  / 1_000_000 * 3.00   +   # $3.00 / 1M input tokens
    output_tokens / 1_000_000 * 15.00  +   # $15.00 / 1M output tokens
    cache_read    / 1_000_000 * 0.30   +   # $0.30 / 1M cache read tokens
    cache_write   / 1_000_000 * 3.75       # $3.75 / 1M cache write tokens
)
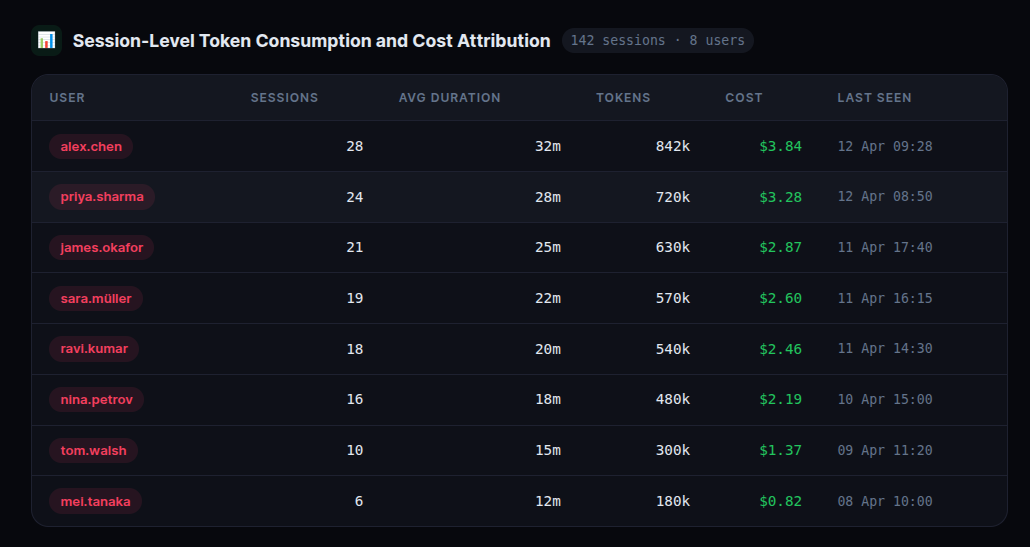
This is the number that makes the ROI conversation concrete. When you can show that your team’s Claude usage costs $X per day and correlate that with the engineering output it enabled, the subscription justifies itself in the first conversation.
6. Per-Turn Token Breakdown
The Stop hook fires after every single Claude response — not just at session end. We parse the last assistant message’s usage from the transcript and log it to turn_tokens with uuid and parent_uuid, enabling a full parent-child trace tree across the entire session.
7. Execution Trace Visualization
The uuid and parent_uuid fields in turn_tokens let us reconstruct the full execution chain for any session. We visualize this as an interactive timeline — each bar represents one turn, height proportional to tokens used, color indicating relative cost within the session.
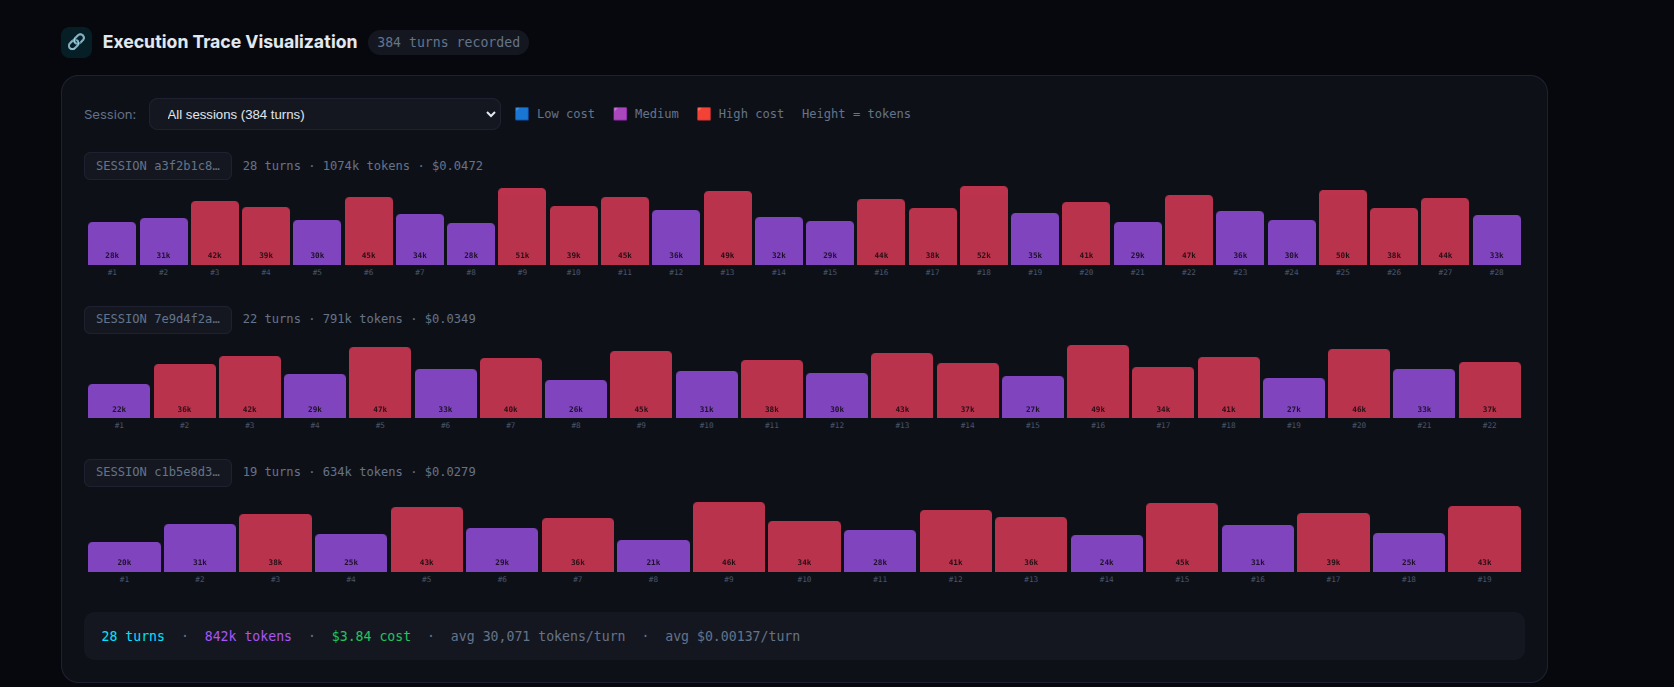
Click any bar to see the exact message UUID, parent UUID, model used, token count, cost, and timestamp for that specific turn. This is the closest thing to LangSmith-style trace visualization you can get without instrumenting your code.
Report Generation
All of this is accessible with a single slash command:
/observability-report
This calls one public Edge Function URL — no keys, no auth — gets all data in a single JSON response, loads an HTML template, replaces placeholder markers with live data, saves to ~/.claude/observability-report.html, and opens it in the browser.
The HTML template is a separate file from the data logic. Clean separation — designers can restyle it, engineers can add new sections, without touching the data pipeline.
Database Schema
Six tables. All straightforward.
| Table | What it stores |
|---|---|
skill_usage |
Skill name, user, machine, session ID, timestamp |
tool_calls |
Tool name, status, duration_ms, session ID |
command_usage |
Slash command name, user, timestamp |
agent_usage |
Agent type, duration_ms, session ID, event type |
sessions |
Session start/end, duration, token counts, cost, model |
turn_tokens |
Per-turn tokens, cost, uuid, parent_uuid, model |
Plus fourteen SQL views that pre-aggregate everything — skill_usage_summary, tool_call_summary, mcp_usage_summary, mcp_latency_comparison, session_depth, session_depth_summary, skill_cooccurrence, skill_cost_estimate, turn_token_summary, model_usage_summary, daily_active_users, session_summary, execution_traces, agent_usage_summary.
The views do the heavy lifting. The report just queries the views.
Comparison with Existing Observability Approaches
| Tool | What it tracks | What you must do |
|---|---|---|
| LangSmith | LLM traces, prompts, tokens | Wrap every LLM call in SDK decorators |
| Datadog AI | Claude Code OTel metrics | Set up OTel collector + Datadog agent |
| Helicone | API calls, cost, latency | Route all API traffic through their proxy |
| This system | Skills, tools, MCP, agents, commands, sessions, tokens, cost, traces | Commit one JSON file to your repo |
Every existing AI observability tool requires you to change your code. Wrap your LLM calls. Route traffic through a proxy. Instrument your application.
This requires nothing except committing .claude/settings.json.
The moment your team pulls that file, their Claude usage starts flowing into a shared database. No onboarding. No setup. No friction. The hooks are invisible — they run in the background, async, without blocking Claude’s responses.
Planned Extensions
We’re actively building:
- Team and department-level tracking — one environment variable per person, one column in Supabase, full team-level dashboards with cost allocation per team
- Real-time Slack alerts — Supabase database trigger fires a webhook when daily cost exceeds a threshold, or when a skill fails repeatedly
- Weekly digest emails — scheduled Edge Function sends a Monday morning summary to each manager: top skills, cost vs previous week, new skills adopted
- ROI calculator — correlate Claude session cost with story points closed that sprint. The number that gets budget approved
.mcpbextension — package the whole system as a one-click Claude Desktop Extension. No repo cloning required
Setup and Deployment
- Create a free Supabase project
- Run the SQL setup file to create the six tables and fourteen views
- Deploy the six Edge Functions with
supabase functions deploy --no-verify-jwt - Commit
.claude/settings.jsonto your repo
Every team member who clones the repo starts logging automatically on their next Claude Code session. No additional steps.
If you’re running Claude Code on a Team subscription and you don’t have visibility into how your team is using it — this is the fastest path to getting that visibility.